Fluent chainable API
Pick a layer, bind your data, choose a type, define — reads top-to-bottom.
Every iXMaps layer reads top-to-bottom — data → binding → type → style — a declarative grammar for thematic maps, equally legible to you and to your AI agent. No build step, no bundler: one script tag from a CDN.
New render the map in plain SVG or OpenGL ↗
This map was created by Claude Code guided by iXMaps skills. See the code ↗ · see only the iXMaps code: ixmap_gdp_minimal ↗
Built for people who want map code they can still read six months later. Everything below ships in the box.
Pick a layer, bind your data, choose a type, define — reads top-to-bottom.
Point a layer at a URL — CSV, GeoJSON, TopoJSON, Parquet & ten more. iXMaps fetches, joins and renders.
Choropleths, proportional symbols, pie & bar markers — switch with one keyword.
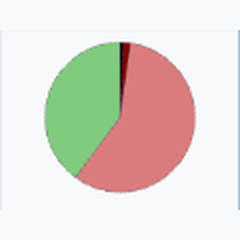
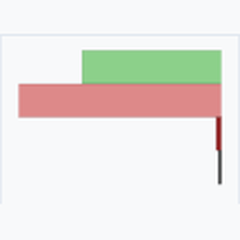
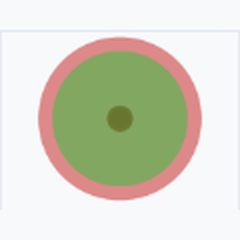
When the built-ins end: plug in D3-drawn chart types, data-driven colorschemes and data preprocessing — without leaving the grammar.
<script src="https://cdn.jsdelivr.net/gh/gjrichter/ixmaps-flat@1/ixmaps.js"></script> <script> const GEO_URL = "https://gisco-services.ec.europa.eu/distribution/v2/countries/topojson/CNTR_RG_60M_2020_4326.json"; const DATA_URL = "https://cdn.jsdelivr.net/gh/gjrichter/ixmaps-data@main/world-gdp-2023/world_gdp_2023_data.csv"; const myMap = ixmaps.Map('map', { mapType: 'white', mapProjection: 'equalearth', mode: 'pan', legend: 'open', align: 'center', tools: false }) .view([0, 0], 1); // chain 1 · geometry layer (FEATURE) — GISCO/Eurostat myMap.layer('countries') .data({ url: GEO_URL, type: 'topojson' }) .binding({ geo: 'geometry', id: 'CNTR_ID', title: 'NAME_ENGL' }) .type('FEATURE') .style({ colorscheme: ['none'], linecolor: '#7a9ab0', linewidth: 0.4 }) .define(); // chain 2 · data join + classification (CHOROPLETH|QUANTILE) — World Bank 2023 myMap.layer('countries') .data({ url: DATA_URL, type: 'csv' }) .binding({ lookup: 'id', value: 'gdp', title: 'name' }) .type('CHOROPLETH|QUANTILE') .style({ colorscheme: ['#deeaf5', '#b3cde3', '#74b3d8', '#3182bd', '#08519c'], fillopacity: 0.82 }) .meta({ name: 'countries_gdp', tooltip: "<b>{{name}}</b><br>GDP <b>${{gdp}}k</b>" }) .title('GDP per Capita (USD k)') .define(); </script>A theme keeps its name after rendering. Address it at runtime — filter it, restyle it, or swap the whole visualization with remove-then-define — no reload, no rebuild. You already did this: the classification switcher on the map at the top is exactly these calls.
myMap.then(api => { // 'countries_gdp' — the theme declared above, found by its name api.changeThemeStyle('countries_gdp', 'filter:WHERE gdp > 20', 'set'); api.changeThemeStyle('countries_gdp', 'fillopacity:0.5', 'set'); api.changeThemeStyle('countries_gdp', 'filter', 'remove'); // back to all countries});Full runtime API in the docs ↗ · switching the type live: swappable themes example ↗
Agent skills are open source on GitHub ↗ — drop them into Claude Code, Codex or Cursor, describe your map and data, and get a working map back. Skilled agents, knowing the grammar, learn just as well from a live example — or skip code entirely and describe it in plain language to Chat2Map.
Drop the skills into Claude Code, Codex or Cursor — your agent writes runnable iXMaps code.
Browse the skills ↗Explore your data, create a visualization in plain language and get a live sharable map — no code.
Try Chat2Map.it ↗Each thumbnail opens a live interactive map built with iXMaps. Pan, hover, read the data.
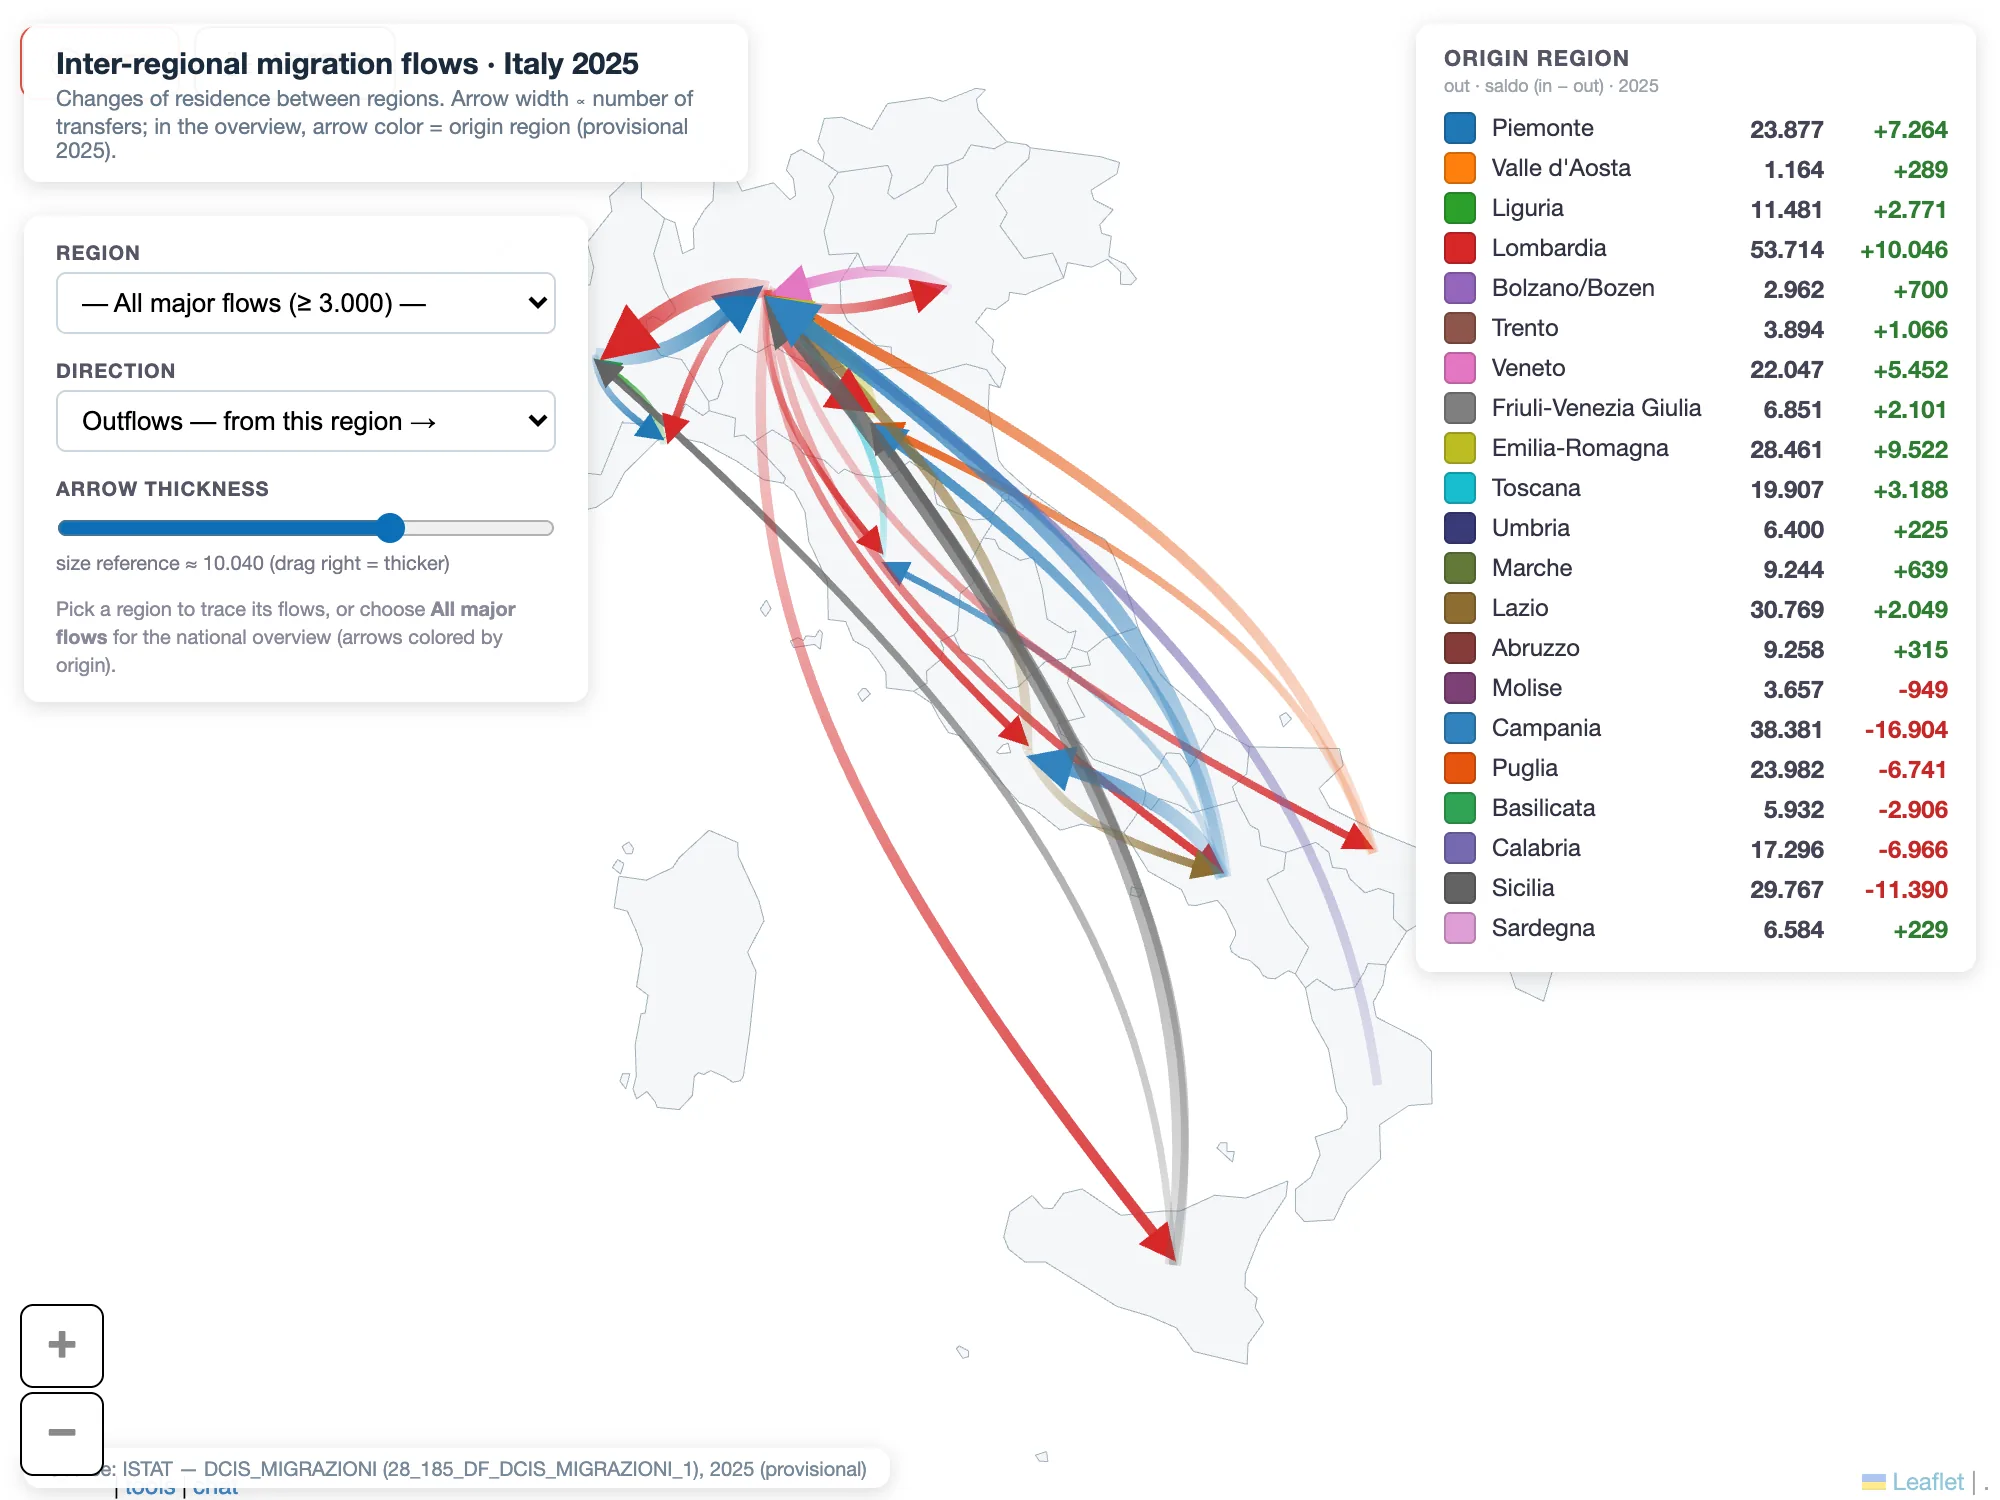
Region-to-region migration rendered as flow lines & proportional bubbles, 2025.
Open ↗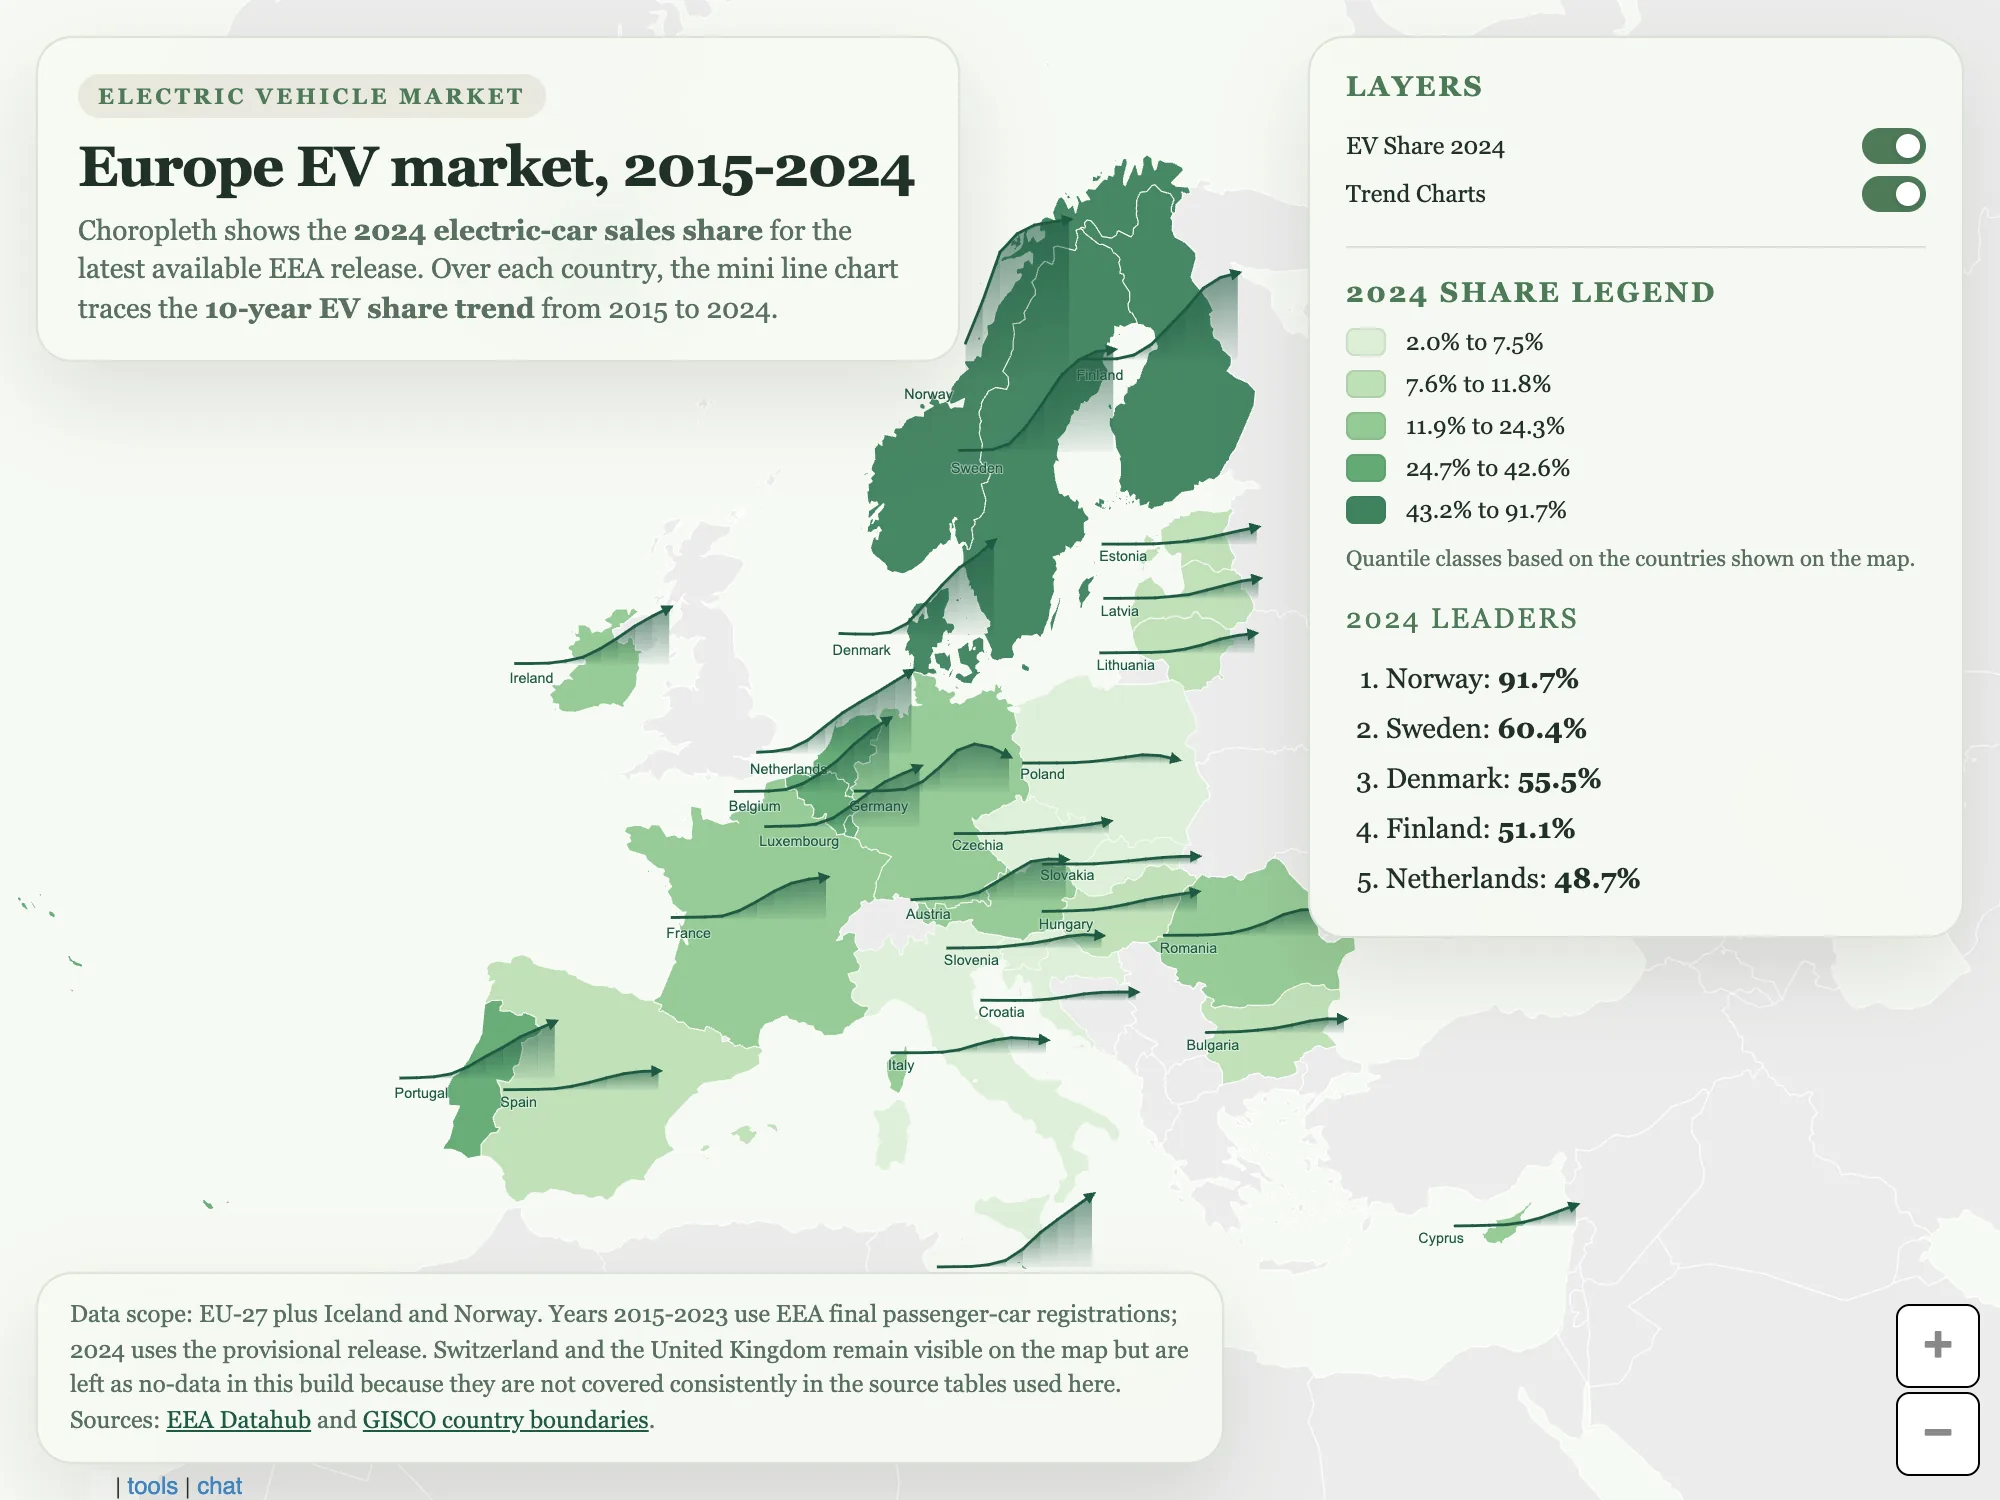
Electric-vehicle adoption across European NUTS regions, animated over time.
Open ↗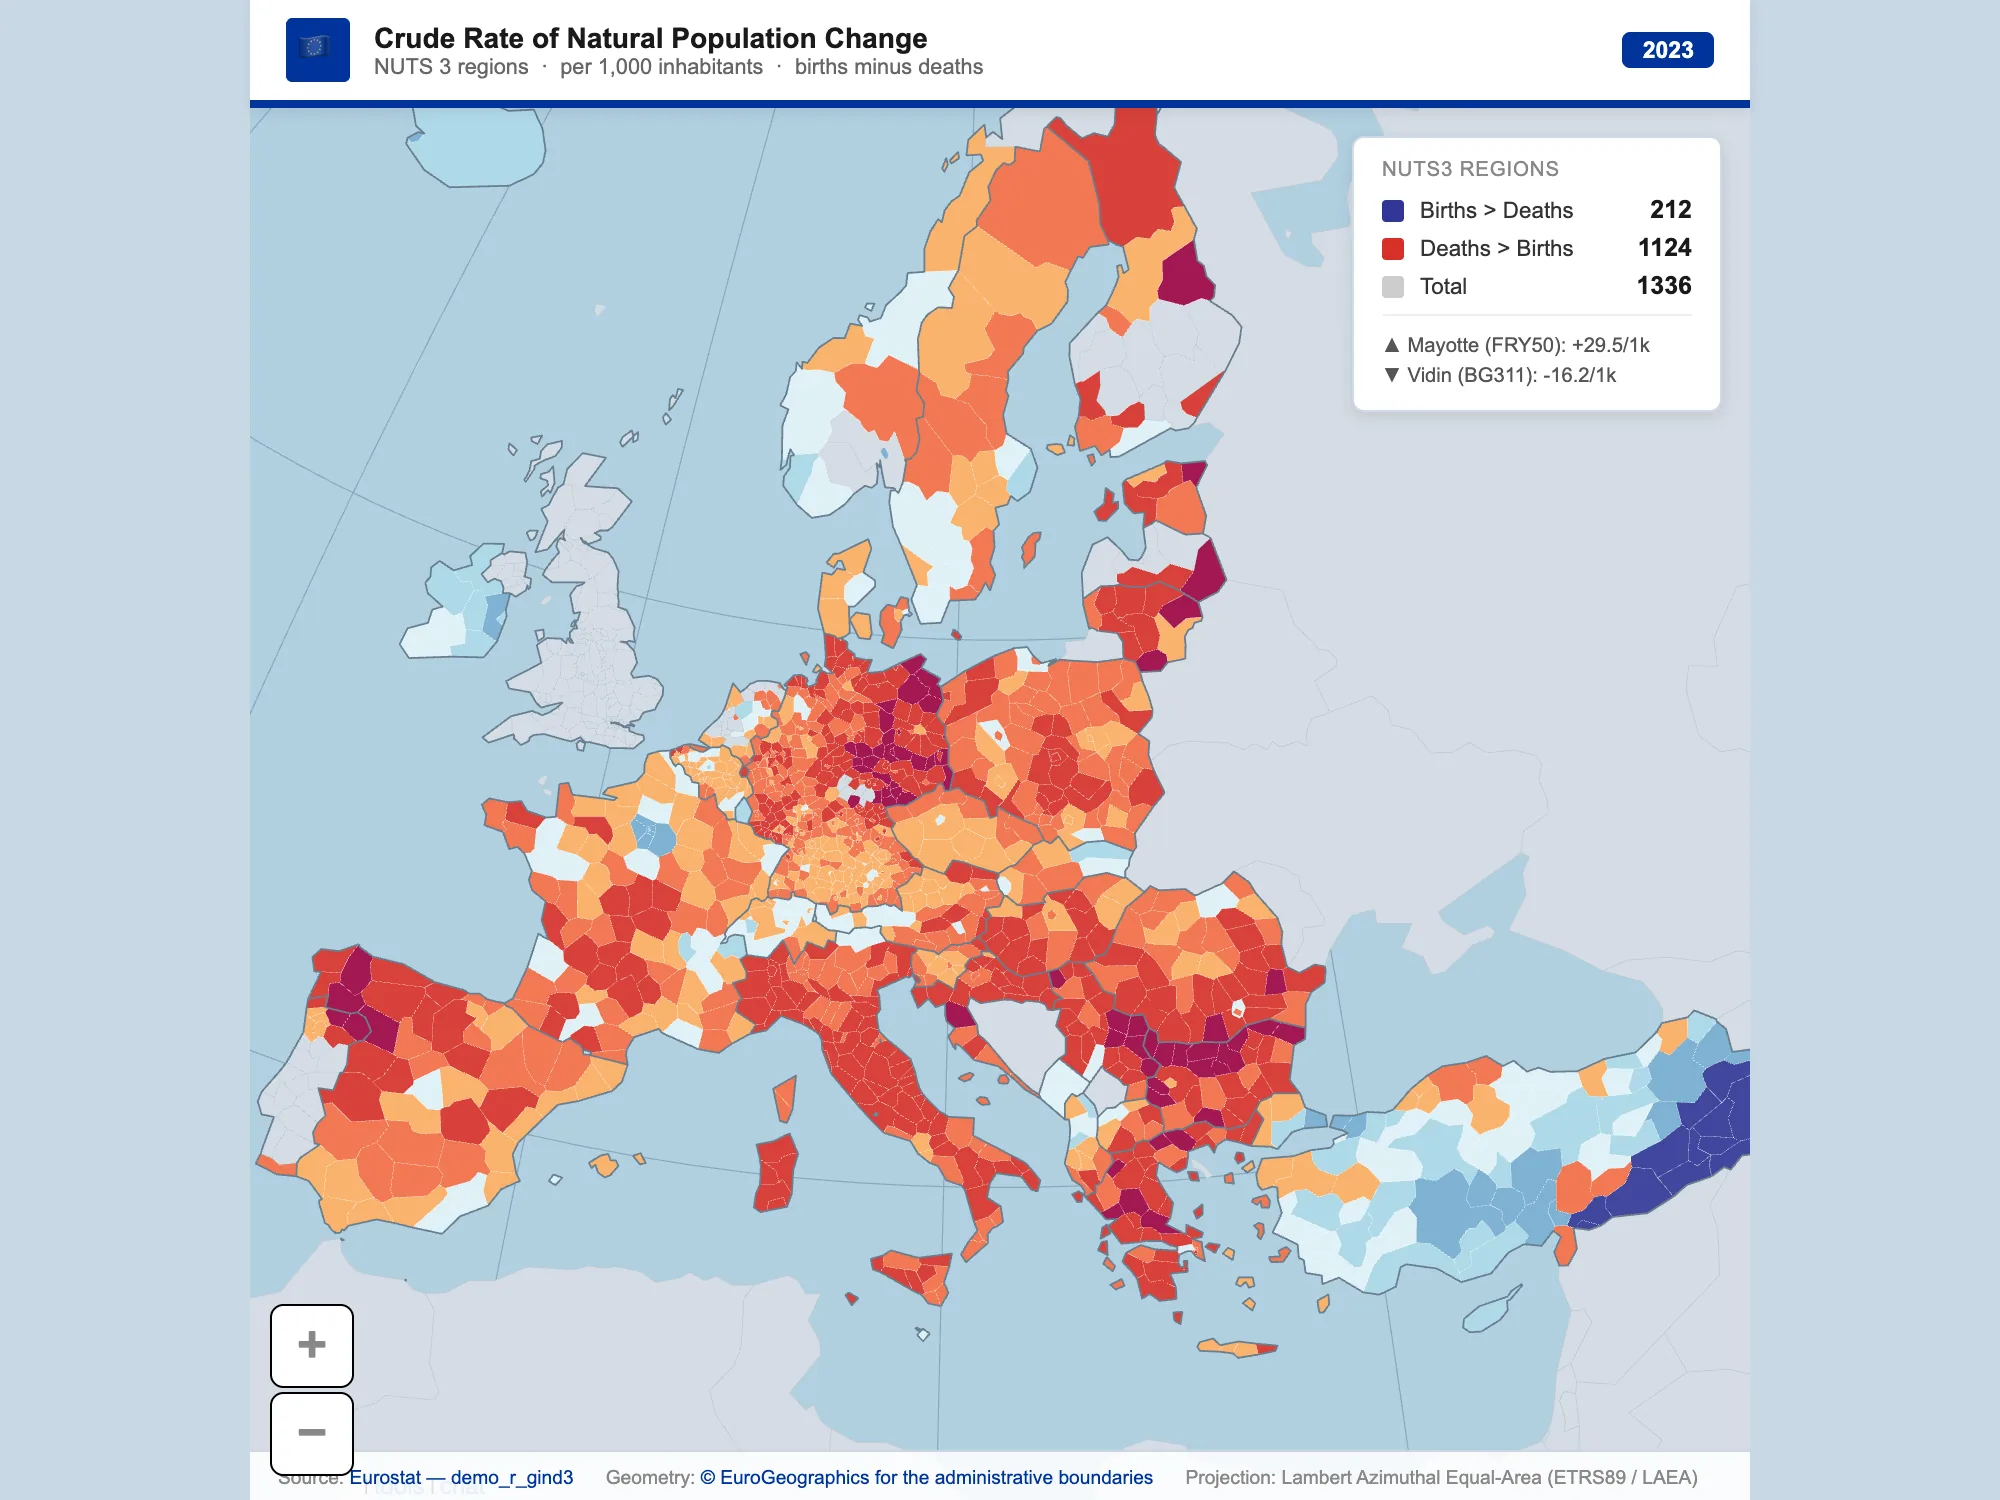
Births minus deaths across NUTS3 regions, Eurostat style.
Open ↗<script src="https://cdn.jsdelivr.net/gh/gjrichter/ixmaps-flat@1/ixmaps.js"></script>
Served from the CDN — no npm package needed, nothing to install.