dati: edifici ad uso non residenziale, Venezia, ISTAT Censimento 2011
  map tiles by Stamen Design, under CC BY 3.0. Data by OpenStreetMap, under CC BY SA 

Vectorgraphic mapping and charting framework

Create multilayer thematic maps in vector graphic (SVG) with stylable vector tiles and geopositioned charts. All handled by a reactive, mobile compatible GUI in HTML5

Try with your own data


vector tile maps

Create vector tiles and complete multilayer vector maps from QGIS projects and shapefiles.

themes and charts

Show your data by turning the map shapes into meaningfull colorized themes or create multiple vector grafic charts as overlay on the map.

bookmark and share

Select one or more themes, move to the view of your interest and even modify the theme. Then bookmark, share or embed 'your' map by an individual URL.
'live' themes

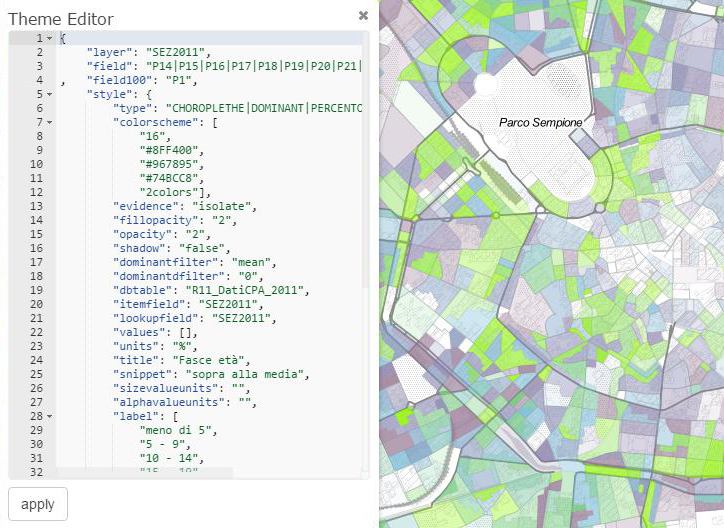
iXMaps defines a high-level visualization grammar for thematic maps. It provides a concise JSON syntax for supporting rapid generation of visualizations from raw data.

Try the theme configurator

Every thematic map can easily be customized by the user by dedicated tools or by changing the theme definition directly by a code editor, realized with the ACE online code editor.

There is actually no limit to customize the theme and with the editor you can create completely new themes.
see also -> API Documentation -> GitHub


bookmark and share

You can share or bookmark your customized theme by an URL which iXMaps creates for you.

This URL contains all information to reproduce the customized map in any HTML5 capable browser.

The sharing function gives you also a code snippet to embed the map into any HTML page.

test it

Tell stories

iXMaps provides simple templates to put together the map an a story in HTML. The HTML Theme API gives you all you need to put themes on the map and change them with your story going on.
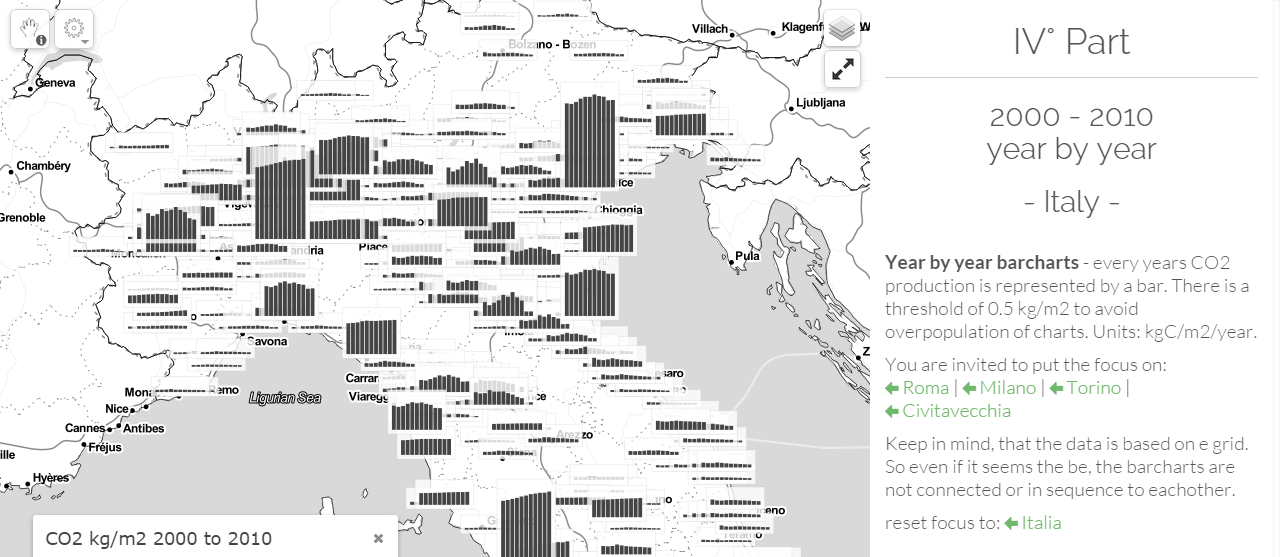
See it live


EXAMPLES

Thematic maps


ICityRate

Città intelligenti

OECD Well Being Index

european regions

UrBes 2015

Benessere Equo e Sostenibile nelle città

DESI 2016

Digital Economy and Society Index

World Happiness Index

World Happiness Report 2016

Movimenti turistici

Open Data dell Regione Puglia

Interventi per la sicurezza

Dati: ISPRA

CO2 kg/m2 da carburanti fossili

data: FFDAS

Entrate e Spese comunali 2014

Open Data SIOPE

World Bank Data Explorer

data from the World Bank Data API

Analisi Raccolta Differenziata

Dati: Regione Piemonte 2011/2014

OpenCensimento

data from ISTAT, 15°Censimento, 2011

Inside Airbnb

Airbnb listings Venice at July 18, 2015

dynamic label placement


Sussidi Europei all'Agricultura

example for dynamic vector label

Multi-Layer vector mapps


Autorita Bacino Interregionale

Multi layer tiled Vector Map

BPlan_bp2070

Multi layer tiled Vector Map

BPlan_la22

Multi layer tiled Vector Map

Carta Tecnica Regionale

Multi layer tiled Vector Map

Corine 2000 Marche

Multi layer tiled Vector Map

Piano Regolatore

Multi layer tiled Vector Map

Isola Giglio

Multi layer tiled Vector Map

Carta Tecnica Regionale - Lecce

Multi layer tiled Vector Map

San Benedetto del Tronto - Edifici

Multi layer tiled Vector Map

Contact Me

For any question please feel free to write me